Earthquakes and
Seismology
Introduction
An
earthquake is a naturally produced shock event which causes the Earth to
vibrate.
Of interest
are:
· their effect
· why they occur
· where they occur
· scientific study of
the Earth's interior and dynamics:
the
structure of the Earth,
composition of the Earth
kinematics and dynamic of plate tectonics.
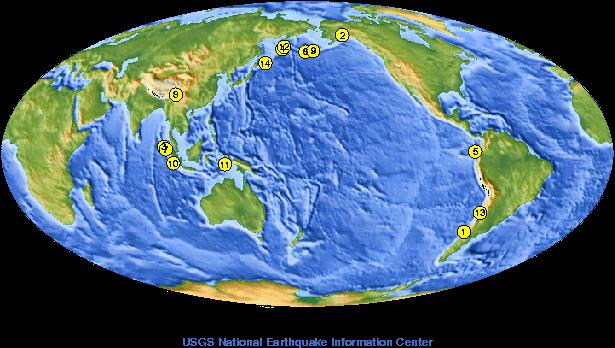
How many Earthquakes?
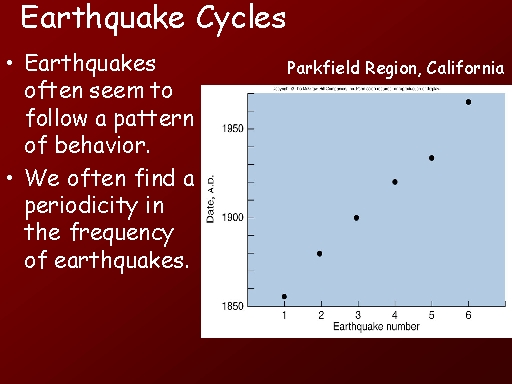
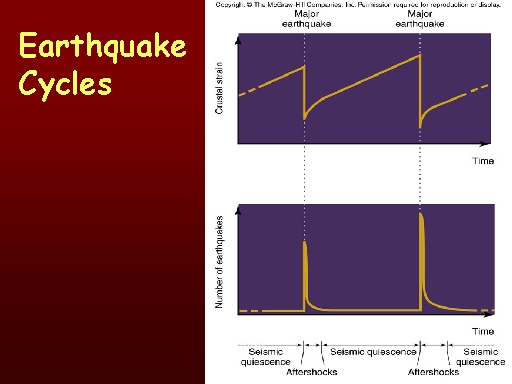
Earthquakes
are very common, many thousands per day all over the world: e.g. map for 18-25th
Oct 2008:
Most are weak
(low energy) and undetected. Here are
those with Mag > 2.5 (see later for definition) for that week:
Update time = Thu Sep 25 11:47:16 UTC 2008
|
|
||||||
|
2.5 |
51.881 |
-176.894 |
60.0 |
ANDREANOF
ISLANDS, ALEUTIAN IS., ALASKA |
||
|
3.0 |
61.306 |
-147.312 |
14.9 |
SOUTHERN
ALASKA |
||
|
2.7 |
53.024 |
-168.050 |
73.3 |
FOX
ISLANDS, ALEUTIAN ISLANDS, ALASKA |
||
|
2.6 |
36.646 |
-121.269 |
7.2 |
CENTRAL
CALIFORNIA |
||
|
3.1 |
62.827 |
-150.917 |
100.0 |
CENTRAL
ALASKA |
||
|
2.6 |
53.413 |
-165.928 |
29.9 |
FOX
ISLANDS, ALEUTIAN ISLANDS, ALASKA |
||
|
4.6 |
38.260 |
-30.073 |
10.0 |
AZORES ISLANDS, PORTUGAL |
||
|
2.7 |
62.835 |
-149.484 |
61.6 |
CENTRAL
ALASKA |
||
|
4.4 |
-16.121 |
-173.561 |
111.4 |
TONGA |
||
|
5.7 |
30.927 |
83.449 |
10.0 |
WESTERN XIZANG |
||
|
2.6 |
63.221 |
-144.849 |
17.3 |
CENTRAL
ALASKA |
||
|
2.5 |
44.632 |
-110.677 |
1.9 |
YELLOWSTONE
NATIONAL PARK, WYOMING |
|
|
||||||
|
4.8 |
-3.254 |
-102.749 |
10.0 |
CENTRAL EAST PACIFIC RISE |
||
|
2.9 |
40.458 |
-124.732 |
20.7 |
OFFSHORE
NORTHERN CALIFORNIA |
||
|
2.8 |
60.168 |
-153.883 |
100.0 |
SOUTHERN
ALASKA |
||
|
3.2 |
51.556 |
178.627 |
28.8 |
RAT
ISLANDS, ALEUTIAN ISLANDS, ALASKA |
||
|
5.2 |
36.213 |
71.172 |
96.9 |
HINDU KUSH REGION, AFGHANISTAN |
||
|
2.6 |
35.993 |
-117.954 |
8.0 |
CENTRAL
CALIFORNIA |
||
|
5.4 |
-22.686 |
-12.771 |
10.0 |
SOUTHERN MID-ATLANTIC RIDGE |
||
|
3.3 |
63.403 |
-150.074 |
5.8 |
CENTRAL
ALASKA |
||
|
3.1 |
54.271 |
-163.313 |
36.5 |
UNIMAK
ISLAND REGION, ALASKA |
||
|
2.5 |
35.440 |
-92.260 |
0.1 |
ARKANSAS |
||
|
2.8 |
55.626 |
-160.180 |
10.2 |
ALASKA
PENINSULA |
||
|
2.5 |
19.399 |
-155.281 |
1.6 |
ISLAND
OF HAWAII, HAWAII |
||
|
4.2 |
63.411 |
-150.068 |
7.4 |
CENTRAL ALASKA |
||
|
4.7 |
36.561 |
70.944 |
183.4 |
HINDU KUSH REGION, AFGHANISTAN |
||
|
2.6 |
59.933 |
-153.143 |
97.7 |
SOUTHERN
ALASKA |
||
|
5.1 |
-10.223 |
161.381 |
92.4 |
SOLOMON ISLANDS |
||
|
2.7 |
64.495 |
-147.945 |
3.9 |
CENTRAL
ALASKA |
||
|
2.6 |
53.764 |
-165.010 |
49.2 |
FOX
ISLANDS, ALEUTIAN ISLANDS, ALASKA |
||
|
2.7 |
36.761 |
-120.868 |
7.2 |
CENTRAL
CALIFORNIA |
||
|
2.9 |
33.369 |
-116.388 |
6.9 |
SOUTHERN
CALIFORNIA |
||
|
6.4 |
17.635 |
-105.520 |
10.0 |
OFF THE COAST OF
COLIMA, MEXICO |
||
|
4.7 |
-14.634 |
167.749 |
103.0 |
VANUATU |
|
|
||||||
|
4.9 |
16.860 |
-99.829 |
45.7 |
GUERRERO, MEXICO |
||
|
3.9 |
61.580 |
-146.456 |
29.5 |
SOUTHERN
ALASKA |
||
|
2.7 |
66.362 |
-150.336 |
3.2 |
NORTHERN
ALASKA |
||
|
3.9 |
36.362 |
71.355 |
89.4 |
HINDU
KUSH REGION, AFGHANISTAN |
||
|
2.6 |
36.617 |
-121.227 |
5.8 |
CENTRAL
CALIFORNIA |
||
|
3.0 |
20.141 |
-155.440 |
31.9 |
HAWAII
REGION, HAWAII |
||
|
2.5 |
53.211 |
-166.851 |
48.0 |
FOX
ISLANDS, ALEUTIAN ISLANDS, ALASKA |
||
|
2.7 |
35.415 |
-118.921 |
18.0 |
BAKERSFIELD
URBAN AREA, CALIFORNIA |
||
|
4.7 |
-24.298 |
-175.427 |
35.0 |
SOUTH OF TONGA |
||
|
3.0 |
37.187 |
-114.543 |
2.2 |
NEVADA |
||
|
3.6 |
34.073 |
73.617 |
35.0 |
PAKISTAN |
||
|
4.6 |
38.477 |
142.885 |
63.8 |
NEAR THE EAST COAST OF HONSHU,
JAPAN |
||
|
4.5 |
15.821 |
-92.964 |
130.2 |
CHIAPAS, MEXICO |
||
|
2.6 |
19.186 |
-155.477 |
6.7 |
ISLAND
OF HAWAII, HAWAII |
||
|
2.7 |
54.582 |
-163.447 |
9.2 |
UNIMAK
ISLAND REGION, ALASKA |
|
|
||||||
|
4.8 |
54.221 |
-35.187 |
10.0 |
REYKJANES RIDGE |
||
|
2.6 |
18.492 |
-65.112 |
48.9 |
VIRGIN
ISLANDS REGION |
||
|
2.8 |
64.492 |
-147.883 |
7.6 |
CENTRAL
ALASKA |
||
|
2.9 |
64.506 |
-147.908 |
8.9 |
CENTRAL
ALASKA |
||
|
5.3 |
-23.445 |
-179.574 |
540.1 |
SOUTH OF THE FIJI ISLANDS |
||
|
2.6 |
51.711 |
-178.566 |
10.2 |
ANDREANOF
ISLANDS, ALEUTIAN IS., ALASKA |
||
|
2.6 |
36.221 |
-120.266 |
10.4 |
CENTRAL
CALIFORNIA |
||
|
4.9 |
-9.765 |
160.214 |
35.2 |
SOLOMON ISLANDS |
||
|
4.5 |
8.399 |
-103.557 |
10.0 |
NORTHERN EAST PACIFIC RISE |
||
|
3.0 |
56.615 |
-154.649 |
13.5 |
KODIAK
ISLAND REGION, ALASKA |
||
|
2.7 |
37.378 |
-104.898 |
5.0 |
COLORADO |
||
|
2.6 |
52.973 |
-167.702 |
46.0 |
FOX
ISLANDS, ALEUTIAN ISLANDS, ALASKA |
||
|
5.4 |
15.563 |
96.112 |
35.0 |
NEAR THE SOUTH COAST OF MYANMAR |
||
|
4.7 |
-24.250 |
-175.906 |
35.0 |
SOUTH OF TONGA |
||
|
2.8 |
51.144 |
-179.505 |
24.8 |
ANDREANOF
ISLANDS, ALEUTIAN IS., ALASKA |
||
|
2.5 |
57.535 |
-155.542 |
78.8 |
ALASKA
PENINSULA |
||
|
5.2 |
-5.999 |
151.005 |
34.1 |
NEW BRITAIN REGION, PAPUA NEW
GUINEA |
||
|
5.7 |
41.603 |
140.457 |
147.3 |
HOKKAIDO, JAPAN REGION |
||
|
4.6 |
16.886 |
-99.787 |
42.5 |
GUERRERO, MEXICO |
||
|
3.1 |
19.152 |
-66.777 |
24.7 |
PUERTO
RICO REGION |
||
|
2.6 |
57.108 |
-155.502 |
31.0 |
ALASKA
PENINSULA |
||
|
3.4 |
17.774 |
-68.911 |
88.8 |
DOMINICAN
REPUBLIC REGION |
||
|
2.8 |
51.913 |
179.607 |
3.6 |
RAT
ISLANDS, ALEUTIAN ISLANDS, ALASKA |
|
|
||||||
|
2.5 |
18.857 |
-67.428 |
11.9 |
PUERTO
RICO REGION |
||
|
4.6 |
-15.632 |
-174.823 |
271.3 |
TONGA |
||
|
5.2 |
-31.363 |
-179.996 |
340.1 |
KERMADEC ISLANDS REGION |
||
|
2.7 |
63.524 |
-146.879 |
3.1 |
CENTRAL
ALASKA |
||
|
3.3 |
18.196 |
-68.075 |
107.7 |
MONA
PASSAGE, DOMINICAN REPUBLIC |
||
|
4.6 |
8.851 |
-102.857 |
10.0 |
NORTHERN EAST PACIFIC RISE |
||
|
4.4 |
-17.730 |
-178.619 |
562.2 |
FIJI REGION |
||
|
3.3 |
17.922 |
-68.142 |
107.6 |
DOMINICAN
REPUBLIC REGION |
||
|
4.7 |
-3.061 |
138.837 |
40.4 |
PAPUA, INDONESIA |
||
|
4.5 |
-23.103 |
179.427 |
519.2 |
SOUTH OF THE FIJI ISLANDS |
||
|
3.2 |
61.579 |
-149.972 |
35.4 |
SOUTHERN
ALASKA |
||
|
4.4 |
-20.294 |
-178.448 |
557.0 |
FIJI REGION |
||
|
4.4 |
-22.185 |
-179.485 |
583.1 |
SOUTH OF THE FIJI ISLANDS |
||
|
4.9 |
-3.976 |
141.437 |
102.4 |
NEW GUINEA, PAPUA NEW GUINEA |
||
|
5.2 |
-16.132 |
-173.869 |
76.3 |
TONGA |
||
|
2.7 |
56.876 |
-155.937 |
6.4 |
ALASKA
PENINSULA |
||
|
3.6 |
19.650 |
-65.993 |
117.2 |
PUERTO
RICO REGION |
|
|
||||||
|
4.9 |
35.561 |
140.121 |
55.1 |
NEAR THE EAST COAST OF HONSHU,
JAPAN |
||
|
4.5 |
8.291 |
-82.174 |
35.5 |
PANAMA-COSTA RICA BORDER REGION |
||
|
3.1 |
56.920 |
-155.780 |
5.7 |
ALASKA
PENINSULA |
||
|
4.7 |
-7.080 |
126.256 |
444.8 |
KEPULAUAN BARAT DAYA, INDONESIA |
||
|
3.5 |
49.991 |
-178.389 |
33.2 |
SOUTH
OF THE ALEUTIAN ISLANDS |
||
|
4.9 |
15.349 |
-91.691 |
204.0 |
GUATEMALA |
||
|
5.4 |
-16.126 |
-73.761 |
41.5 |
NEAR THE COAST OF SOUTHERN PERU |
||
|
2.8 |
51.974 |
175.000 |
22.4 |
RAT
ISLANDS, ALEUTIAN ISLANDS, ALASKA |
||
|
2.6 |
19.147 |
-67.046 |
13.1 |
PUERTO
RICO REGION |
||
|
2.7 |
19.037 |
-66.793 |
13.2 |
PUERTO
RICO REGION |
||
|
2.9 |
51.100 |
179.365 |
15.8 |
RAT
ISLANDS, ALEUTIAN ISLANDS, ALASKA |
||
|
4.8 |
14.083 |
50.244 |
10.0 |
NEAR THE COAST OF YEMEN |
||
|
5.2 |
63.588 |
-129.029 |
10.0 |
NORTHWEST TERRITORIES, CANADA |
||
|
5.2 |
14.459 |
-92.211 |
60.7 |
OFFSHORE GUATEMALA |
||
|
2.8 |
52.112 |
-168.203 |
32.9 |
FOX
ISLANDS, ALEUTIAN ISLANDS, ALASKA |
||
|
4.6 |
-29.309 |
-70.506 |
67.6 |
COQUIMBO, CHILE |
||
|
4.3 |
19.327 |
-155.106 |
9.7 |
ISLAND OF HAWAII, HAWAII |
||
|
5.3 |
38.420 |
73.423 |
146.1 |
TAJIKISTAN |
||
|
4.4 |
13.383 |
-90.476 |
88.0 |
OFFSHORE GUATEMALA |
||
|
2.6 |
53.785 |
-165.248 |
56.0 |
FOX
ISLANDS, ALEUTIAN ISLANDS, ALASKA |
||
|
4.2 |
36.524 |
70.958 |
189.0 |
HINDU KUSH REGION, AFGHANISTAN |
|
|
||||||
|
2.6 |
62.980 |
-149.291 |
73.3 |
CENTRAL
ALASKA |
||
|
2.8 |
53.719 |
-164.062 |
25.7 |
UNIMAK
ISLAND REGION, ALASKA |
||
|
5.5 |
-11.167 |
164.491 |
29.2 |
SANTA CRUZ ISLANDS REGION |
||
|
3.0 |
50.217 |
178.402 |
14.9 |
RAT
ISLANDS, ALEUTIAN ISLANDS, ALASKA |
||
|
3.1 |
53.730 |
-164.092 |
4.4 |
UNIMAK
ISLAND REGION, ALASKA |
||
|
3.1 |
32.922 |
-115.878 |
7.0 |
SOUTHERN
CALIFORNIA |
||
|
4.9 |
-7.098 |
-13.025 |
10.0 |
ASCENSION ISLAND REGION |
||
|
4.6 |
23.787 |
142.921 |
15.0 |
VOLCANO ISLANDS, JAPAN REGION |
||
|
4.5 |
26.152 |
128.786 |
17.7 |
RYUKYU ISLANDS, JAPAN |
||
|
2.8 |
52.096 |
-175.439 |
14.3 |
ANDREANOF
ISLANDS, ALEUTIAN IS., ALASKA |
||
|
5.1 |
-23.990 |
-175.907 |
55.9 |
TONGA REGION |
||
|
3.8 |
18.470 |
-66.035 |
119.9 |
PUERTO
RICO REGION |
||
|
4.8 |
-24.529 |
-175.856 |
53.2 |
SOUTH OF TONGA |
||
|
3.4 |
58.785 |
-140.335 |
36.2 |
OFF
THE COAST OF SOUTHEASTERN ALASKA |
||
|
3.3 |
58.783 |
-140.311 |
15.8 |
OFF
THE COAST OF SOUTHEASTERN ALASKA |
||
|
2.7 |
32.114 |
-115.816 |
6.0 |
BAJA
CALIFORNIA, MEXICO |
||
|
2.6 |
54.366 |
-164.074 |
19.6 |
UNIMAK
ISLAND REGION, ALASKA |
||
|
2.7 |
53.769 |
-164.081 |
25.6 |
UNIMAK
ISLAND REGION, ALASKA |
||
|
2.5 |
53.677 |
-163.995 |
32.2 |
UNIMAK
ISLAND REGION, ALASKA |
||
|
4.7 |
5.042 |
94.243 |
35.0 |
NORTHERN SUMATRA, INDONESIA |
||
|
4.6 |
-13.827 |
-172.582 |
61.3 |
SAMOA ISLANDS |
||
|
2.6 |
54.813 |
-161.720 |
43.5 |
ALASKA
PENINSULA |
||
|
2.7 |
54.451 |
-161.510 |
7.9 |
ALASKA
PENINSULA |
||
|
2.8 |
63.292 |
-151.492 |
11.5 |
CENTRAL
ALASKA |
||
|
2.9 |
63.296 |
-151.595 |
5.0 |
CENTRAL
ALASKA |
||
|
2.8 |
37.538 |
-118.865 |
8.5 |
CENTRAL
CALIFORNIA |
||
|
3.1 |
33.963 |
-117.789 |
15.5 |
GREATER
LOS ANGELES AREA, CALIFORNIA |
||
|
4.4 |
-17.558 |
-178.584 |
584.2 |
FIJI REGION |
||
|
2.6 |
50.075 |
-178.422 |
28.4 |
ANDREANOF
ISLANDS, ALEUTIAN IS., ALASKA |
||
|
2.6 |
37.417 |
-113.129 |
1.2 |
UTAH |
||
|
2.7 |
49.971 |
-178.461 |
26.7 |
SOUTH
OF THE ALEUTIAN ISLANDS |
||
|
2.8 |
51.710 |
-179.012 |
3.2 |
ANDREANOF
ISLANDS, ALEUTIAN IS., ALASKA |
||
|
3.0 |
51.619 |
-179.036 |
4.3 |
ANDREANOF
ISLANDS, ALEUTIAN IS., ALASKA |
|
|
||||||
|
2.5 |
52.341 |
-169.777 |
138.4 |
FOX
ISLANDS, ALEUTIAN ISLANDS, ALASKA |
||
|
2.5 |
52.341 |
-169.777 |
138.4 |
FOX
ISLANDS, ALEUTIAN ISLANDS, ALASKA |
||
|
5.3 |
10.917 |
91.783 |
12.9 |
ANDAMAN ISLANDS, INDIA REGION |
||
|
4.7 |
59.502 |
-152.793 |
89.9 |
SOUTHERN ALASKA |
||
|
4.7 |
59.502 |
-152.793 |
89.9 |
SOUTHERN ALASKA |
||
|
2.9 |
66.929 |
-157.471 |
6.2 |
NORTHERN
ALASKA |
||
|
2.9 |
66.929 |
-157.471 |
6.2 |
NORTHERN
ALASKA |
||
|
5.0 |
-4.712 |
153.271 |
83.7 |
NEW IRELAND REGION, PAPUA NEW
GUINEA |
||
|
3.3 |
35.188 |
-119.430 |
19.2 |
CENTRAL
CALIFORNIA |
||
|
2.7 |
18.876 |
-64.402 |
18.9 |
VIRGIN
ISLANDS REGION |
||
|
3.1 |
60.581 |
-137.101 |
7.3 |
SOUTHERN
YUKON TERRITORY, CANADA |
||
|
4.6 |
34.960 |
136.806 |
323.6 |
WESTERN HONSHU, JAPAN |
||
|
5.9 |
51.969 |
158.346 |
67.4 |
NEAR THE EAST COAST OF KAMCHATKA,
RUSSIA |
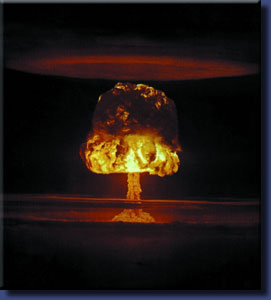
Large Earthquakes
Large energy
earthquakes are rare but cause wide scale social disruption.
May 2008
Eastern Sichuan, China >87,000 fatalities
Oct 2005 Pakistan >86,000
fatalities
Dec 2004
Sumatra-Andaman >227,000
fatalities
July 1976
Tangshan, China >650,000 fatalities
May 1970 Lima, Peru >66,000
fatalities
Oct 1948 Ashgabat,
USSR >110,000 fatalities
May 1927 Nan-Shan, China >200,000
fatalities
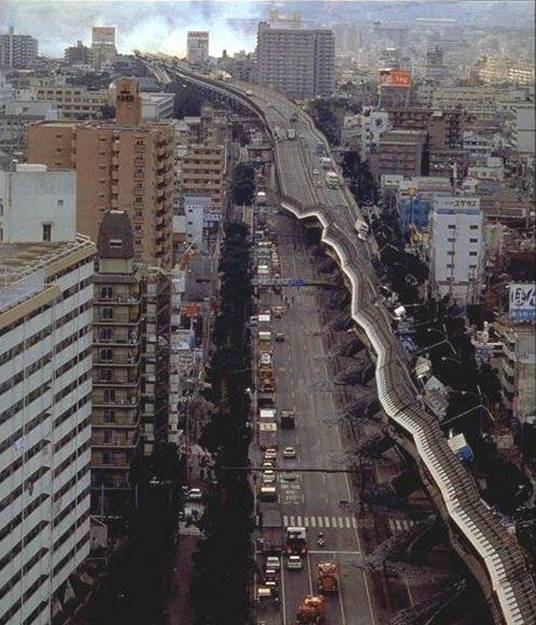
Sep 1923 Tokyo, Japan >142,000 fatalities
Dec 1920 Haiyuan, China >200,000 fatalities
Dec 1908 Messina, Italy >72,000 fatalities
1556 China ~830,000
fatalities
1138 Syria ~230,000
fatalities
856 Iran ~200,000 fatalities
Largest
Recorded Earthquake
Chile 1960
May 22 19:11:14 UTC, Magnitude 9.5
![]() More
than 2,000 killed, 3,000 injured, 2,000,000 homeless, and $550 million damage
in southern Chile;
More
than 2,000 killed, 3,000 injured, 2,000,000 homeless, and $550 million damage
in southern Chile;
![]() Tsunami
caused 61 deaths, $75 million damage in Hawaii;
Tsunami
caused 61 deaths, $75 million damage in Hawaii;
![]() 138
deaths and $50 million damage in Japan;
138
deaths and $50 million damage in Japan;
![]() 32
dead and missing in the Phillippines; and
32
dead and missing in the Phillippines; and
![]() $500,000
damage to the west coast of the United States.
$500,000
damage to the west coast of the United States.
Why are there Earthquakes?
Earthquakes
result from sudden displacement of
crust, usually along faults.
![]() Often
come in a series of quakes - "minor" aftershocks common.
Often
come in a series of quakes - "minor" aftershocks common.
![]() The
earth rings like a bell after a large earthquake occurs.
The
earth rings like a bell after a large earthquake occurs.
![]() Very
long wavelength surface waves circle the globe and interfere constructively to
set up harmonic oscillations.
Very
long wavelength surface waves circle the globe and interfere constructively to
set up harmonic oscillations.
![]() The
shape of an oscillation is determined by the wavelength of the waves, and the
frequency of the oscillation by the internal velocity structure.
The
shape of an oscillation is determined by the wavelength of the waves, and the
frequency of the oscillation by the internal velocity structure.
![]() Analysed
by spherical harmonics….
Analysed
by spherical harmonics….

l=3 m=0 l=3, m= +/-1
l=3, m=+/- 2 l=3, m=+/-3
Shocks give
rise to landslips, turbidity currents,…..
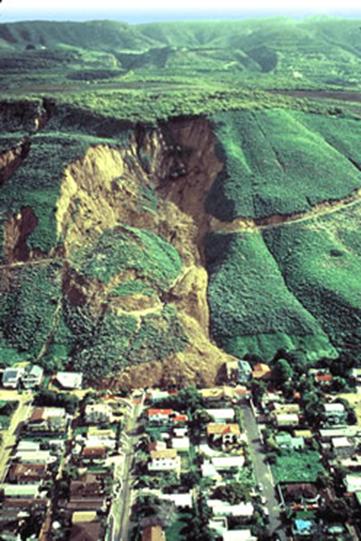
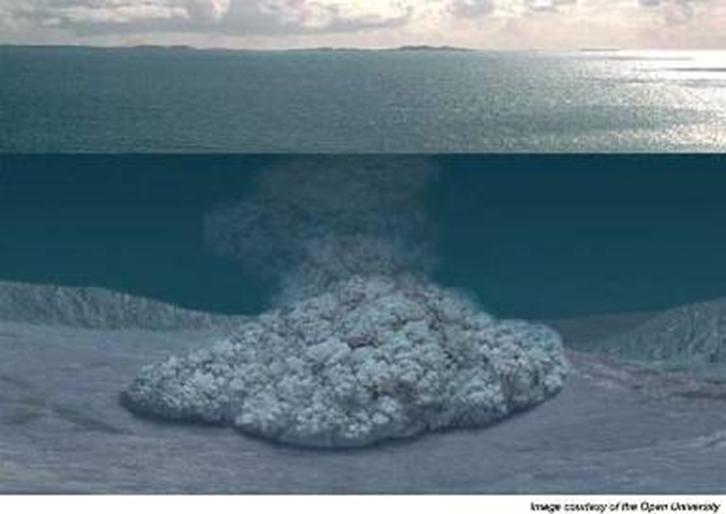
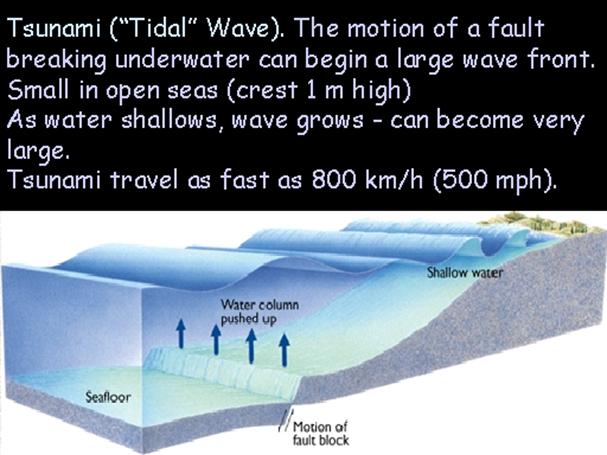
….and
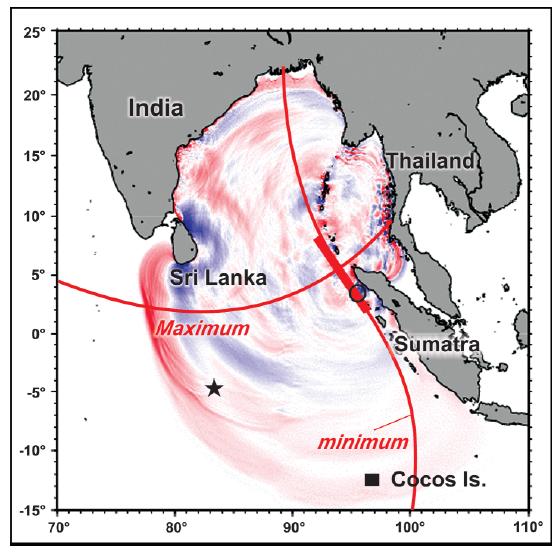
tsunamis:

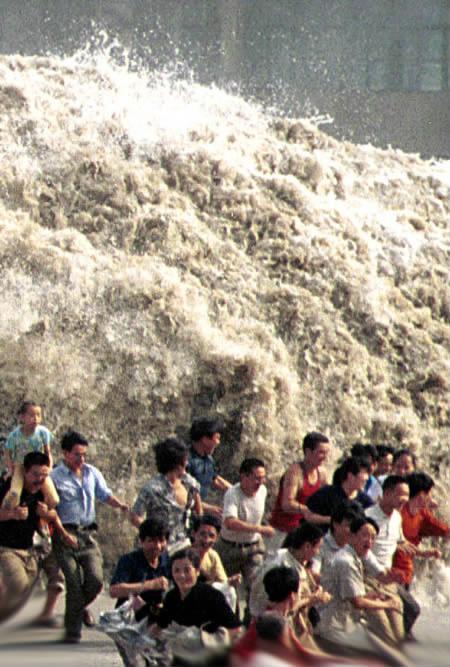
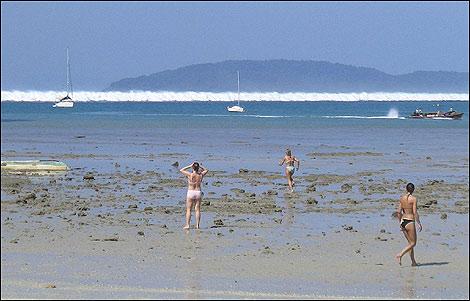
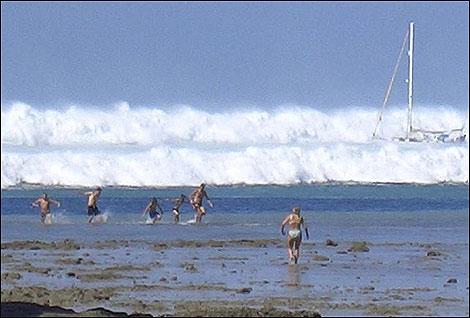
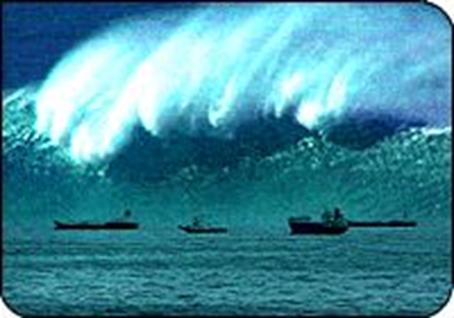
e.g. Sumatra-Andaman Earthquake 26th Dec2004
![]() Magnitude 9.0
Magnitude 9.0
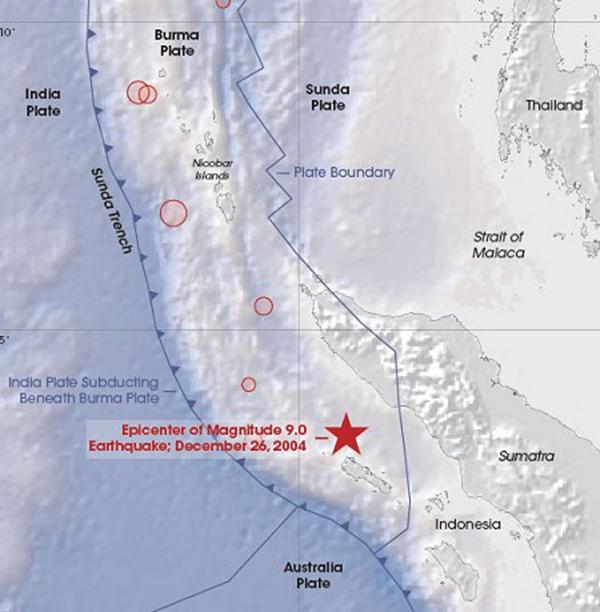
![]() Large rupture zone:
Large rupture zone:

![]() Rupture lasted 8
mins, and travels at 2.8km/sec.
Rupture lasted 8
mins, and travels at 2.8km/sec.
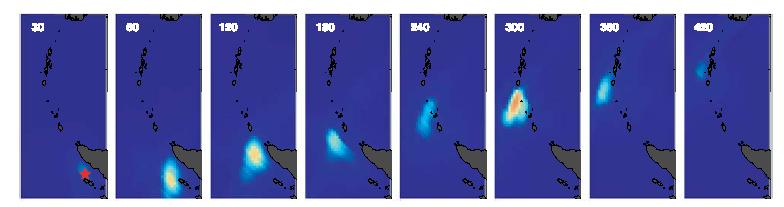
![]() Produced massive
tsunami:
Produced massive
tsunami:
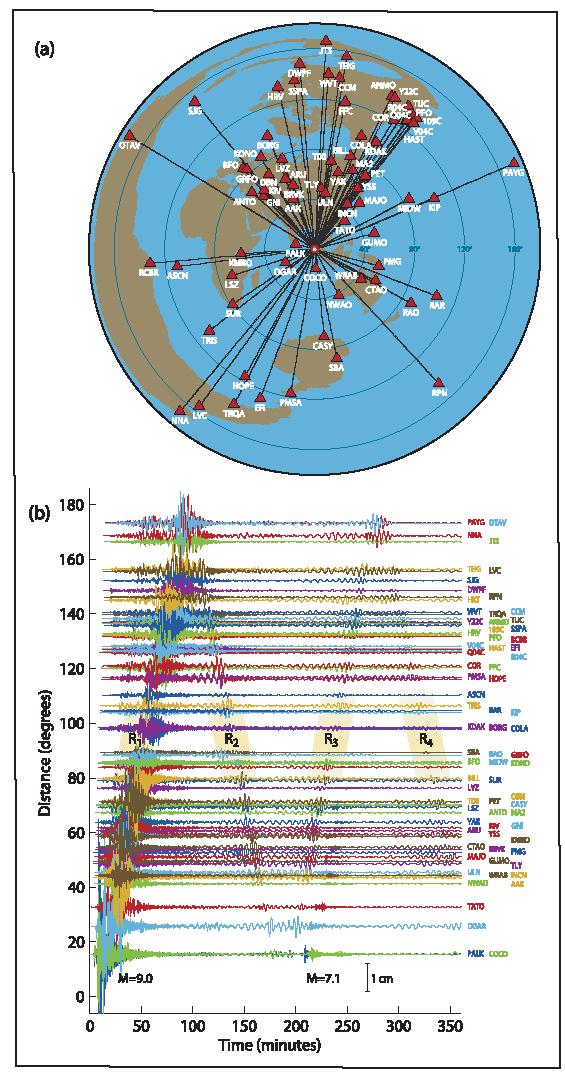
![]() Surface waves seen in
seismograms as they travel around the world:
Surface waves seen in
seismograms as they travel around the world:
In this Lecture will discuss:
- earthquake cause and mechanism
- earthquake locations and
distribution
- earthquake size: magnitude and
intensity
- seismic waves and the interior of
the earth
- seismotectonics
- earthquake prediction and control
Measurement
of seismic waves
Earthquake
waves recorded on a SEISMOMETER -> SEISMOGRAM.
![]()
![]() Seismometers
originally consisted of a rigid frame attached to the Earth, a chart recorder
attached to frame, a heavy mass suspended from frame by a pivot and a pen
attached to mass.
Seismometers
originally consisted of a rigid frame attached to the Earth, a chart recorder
attached to frame, a heavy mass suspended from frame by a pivot and a pen
attached to mass.
![]() Modern
ones were based on solenoids and give digitised data, etc.
Modern
ones were based on solenoids and give digitised data, etc.
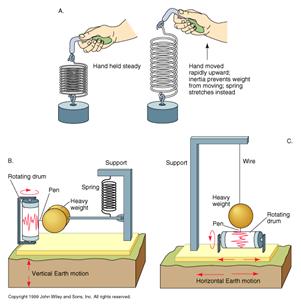
![]() When
the frame is shaken by an earthquake, the mass and pen remain stationary.
When
the frame is shaken by an earthquake, the mass and pen remain stationary.
![]() The
scale of the displacement is recorded on chart.
The
scale of the displacement is recorded on chart.
![]() The
mass is stationary because of inertia.
The
mass is stationary because of inertia.
![]() The
pivot restricts recording to just one plane.
The
pivot restricts recording to just one plane.
![]() Three
seismometers are needed to measure earthquakes.
Three
seismometers are needed to measure earthquakes.
![]() One
for vertical movements and two for horizontal movements.
One
for vertical movements and two for horizontal movements.
![]() Often
have more seismometers with different masses to record shocks with different
frequencies - seismic vibrations have spectrum of frequencies.
Often
have more seismometers with different masses to record shocks with different
frequencies - seismic vibrations have spectrum of frequencies.
o Typically record waves
with short-periods - 12s,
o and
long-periods - 20s.
Earthquake
causes and mechanisms
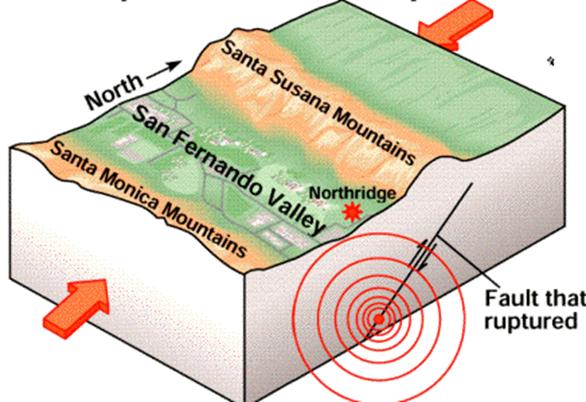
Major earthquakes occur at plate boundaries – reasonable to infer that the cause
of earthquakes is the relative motion of sections of the lithosphere.
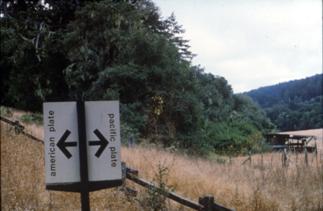
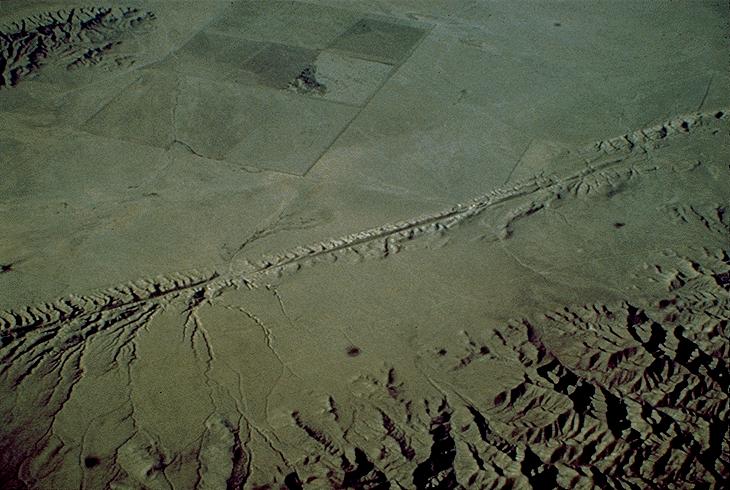
San Andreas pacific-american
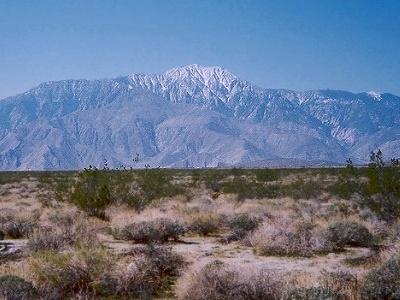
Mount San Jacinto, California
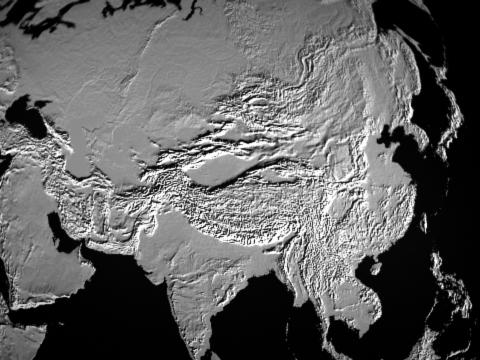
Indian into Eurasian plate
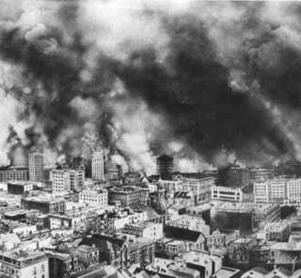
Explanation
of earthquakes is elastic rebound theory,
put forward by H. F. Reid in 1906 after the San Francisco earthquake.
An
earthquake derives from a fault,
that separates two blocks which are attempting to move relative to each other.
Friction or
cementing will resist the movement.
Under these
conditions crustal stresses do not move blocks, but a state of strain builds up in the region of the fault.
If crustal stresses increase (because of movement
elsewhere on the fault, etc.) they will reach a level where they overcome frictional restraint, and the
two blocks will slip relative to each other leading to an earthquake.
This process
can occur time after time, so called stick-slip
movement.
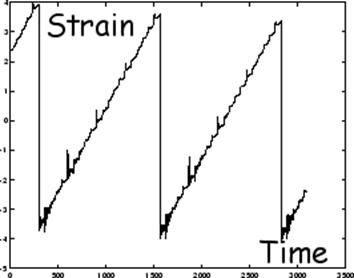
Time between movements can be years.
The longer
the time, the larger the stress and strain, the larger the earthquake.
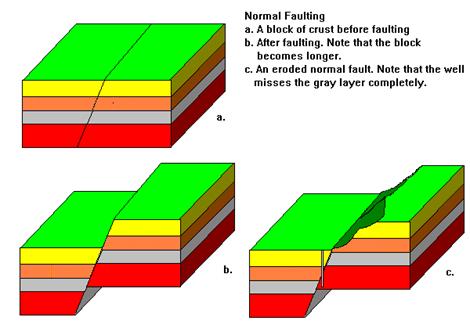
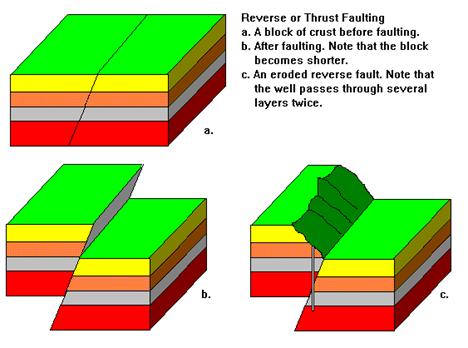
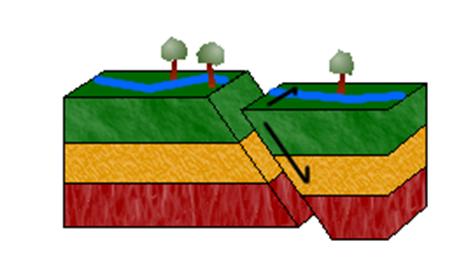
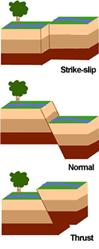
Types of fault
There are
three main types of fault movement, each give distinctive EQ patterns (see
below):
normal
fault
thrust fault
strike-slip fault
oblique-slip
fault
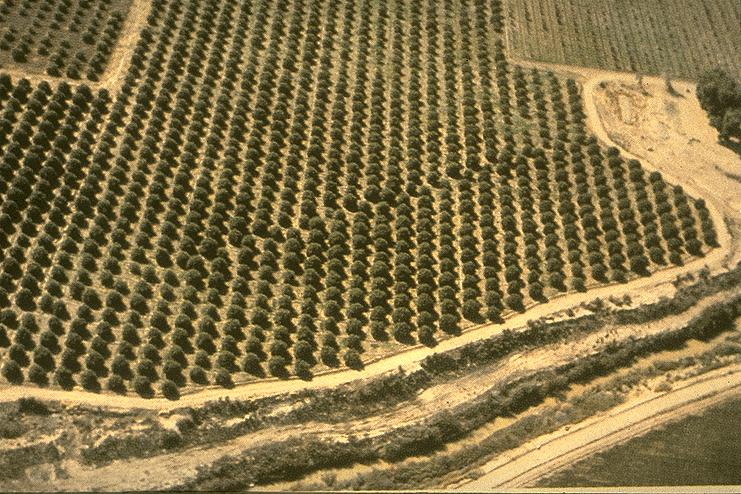 strike-slip
in S.California
strike-slip
in S.California
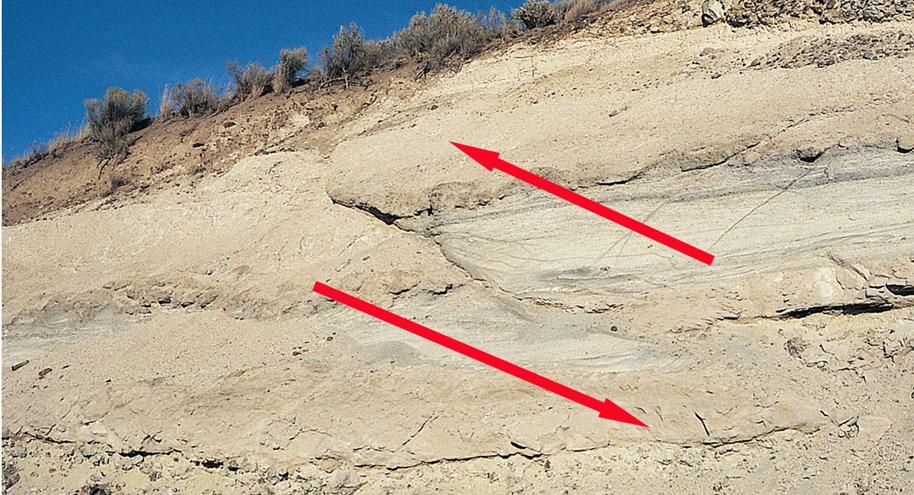
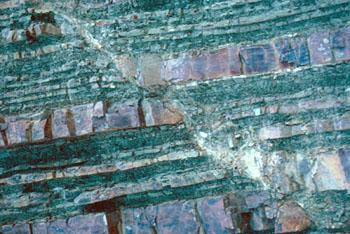
Reverse
faults
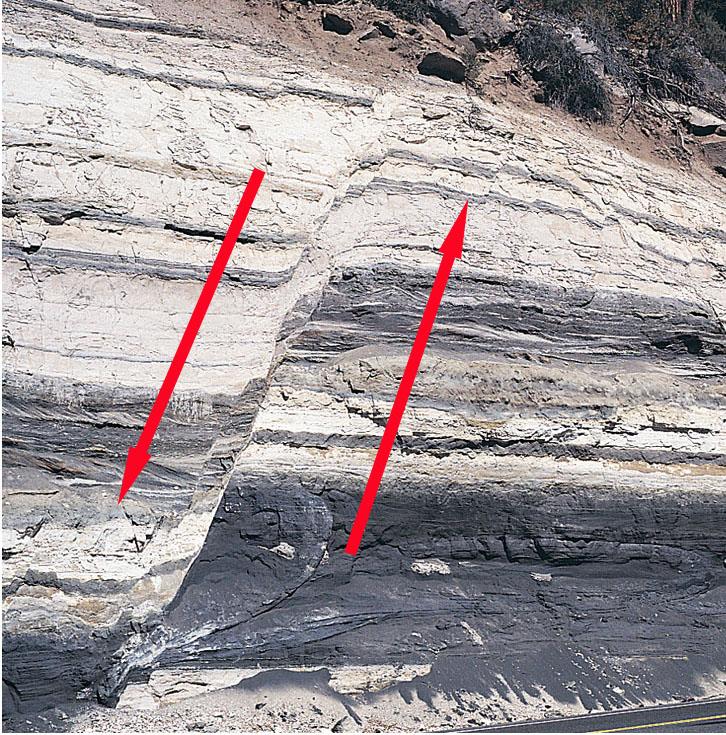
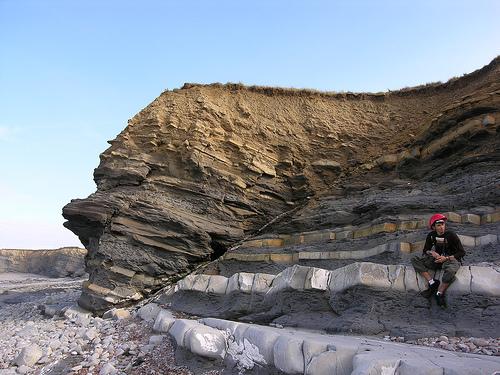
Normal
faults
Earthquake
location and distribution
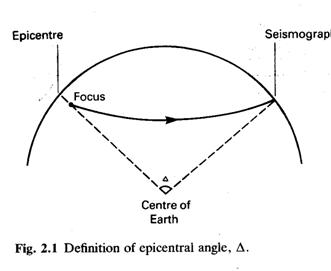
Focus - The source - a small part of a fault (approx.
a few kms3) - can be regarded as a point .
Epicentre - The point on the surface, vertically above the focus.
Focal Depth - The distance from the epicenter to the focus.
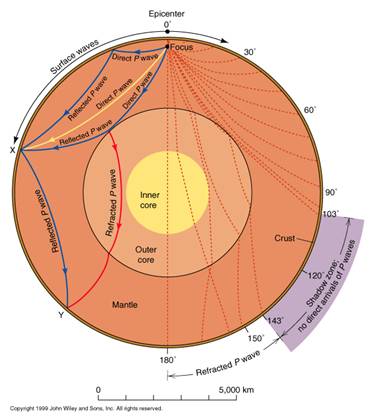
Shock waves
radiate out from focus in all directions.
They are
first felt at the surface at the epicentre.
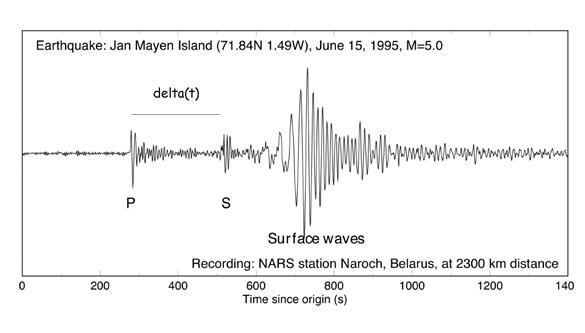
Location of epicentre
If
we have seismographs from three stations relatively close to the epicentre, we
can deduce the position of the epicentre by the time intervals between the P
and the S waves at each station - given knowledge of the P and S wave
velocities (from standard seismic models).
If
local P and S near-surface velocities are VP and VS and
the station is X km from epicentre, then
Time
for P wave arrival (tp) = X / VP
Time for S wave arrival (ts) = X / VS
Therefore
interval between P and S arrival
Δt = tS-tP
= X / VS - X / VP
Thus
re-arranging to find X gives
X = VS.VP.
Δt / (VP - VS)
Units - VP,VS in kms-1;
Δt in s; X in km
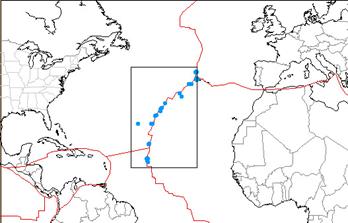
To
locate the epicentre we need values of X from three stations -> Triangulation.
The
epicentre is at the intersection of three circles of radii X1, X2
and X3 based at stations 1, 2 and 3.
World-wide
have there are several thousand stations.
These are often
arranged as SEISMIC ARRAYS in a well
defined geometrical distribution. This can be either for local use such as the
Evergreen Basin seismic imaging study (below left) or a broader array such as
the Eastern Turkey Seismic Array (below right).

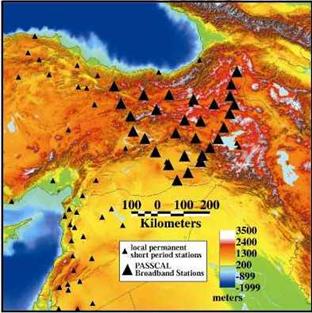
Necessarily
most seismic stations and arrays are land based, so there is a significantly
uneven coverage of the seismic structure of the Earth. Recent attempts to
address this problem include the MERMAID
project that uses passively drifting
autonomous hydrophones recording hundreds of distant earthquakes.
Arrays can
give both near-surface data and also information about the deeper structure of
Earth.
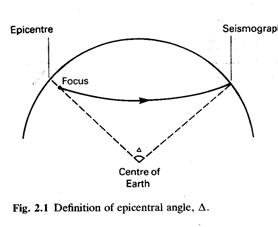
Depth of focus (h)
·
In order to establish the depth of focus, we need
to determine the epicentral angle – Δ
·
This
is done from travel time curve, as ts-tp
is a simple function of Δ:
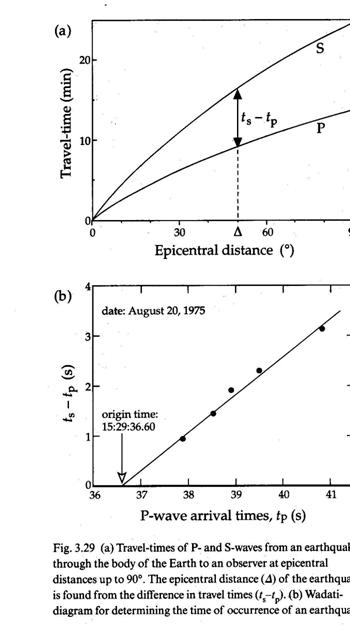
·
Then, a plot of ts-tp v. tp
for several stations give t0,
the time the earthquake occurred.
·
Then,
if V is the P-wave velocity, distance of detector (D) to focus is:
D = (tp-t0)V
·
Now
can obtain h, since:
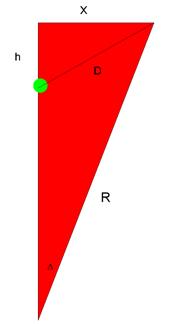
·
X = R .
Δ . (2π/360) and so:
h ~ √(D2
– X2)
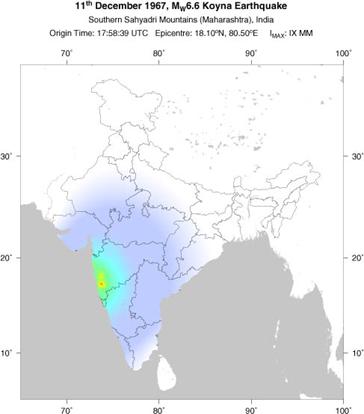
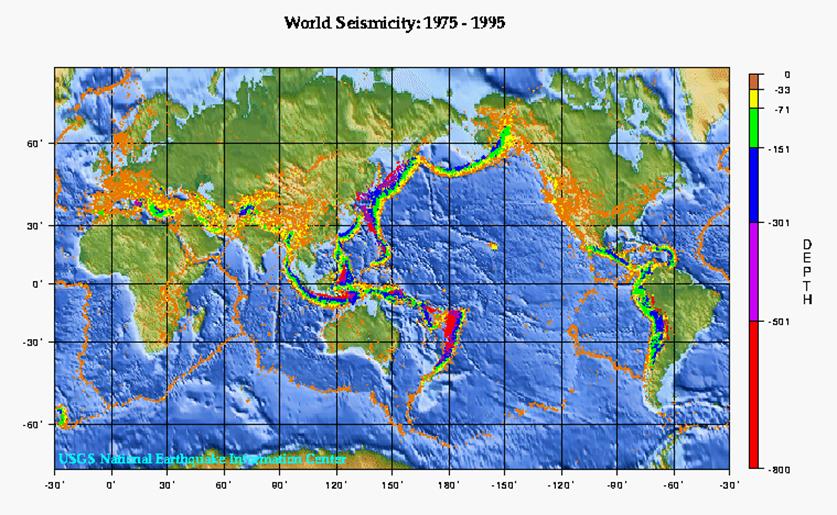
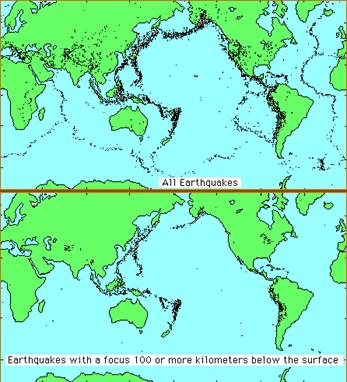
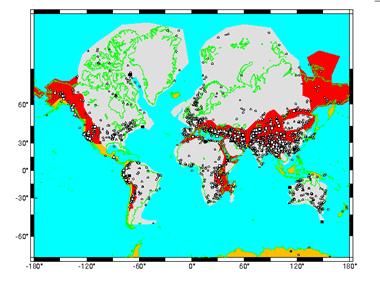
Global Distribution
·
All
earthquakes occur at depths < 700 km and are confined to the rigid
lithosphere.
·
Three
classifications
Shallow focus 0-70 km
Intermediate focus 70-300 km
Deep focus 300-700
km
·
With
large Earthquakes (magnitude > 7 ):
o 75%
Shallow,
o 90%
Intermediate,
o ~100% Deep occur
around the margins of the Pacific
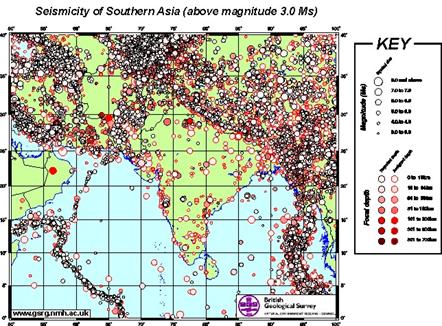
·
Those
not in circum-Pacific belt occur in Alpine-Himalayan belt and along plate
boundaries.
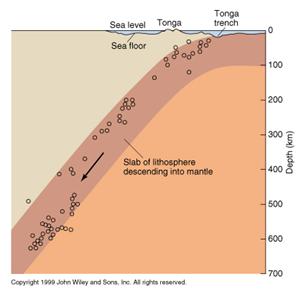
·
Deep
Earthquakes largely from subducted slabs:
·
Also
high concentration of shallow Earthquakes (mag. 4-6) along ocean ridge system.
·
Intra-plate
Earthquakes are rarer (but do occur, e.g. Lisbon 1755).
·
Shallow
Earthquakes much more common than Intermediate and Deep.
·
Most
surface damage is caused by Shallow Earthquakes.
Earthquake
size: magnitude and intensity
Earthquake magnitude is an “absolute” measure of
size, and is related to the energy released.
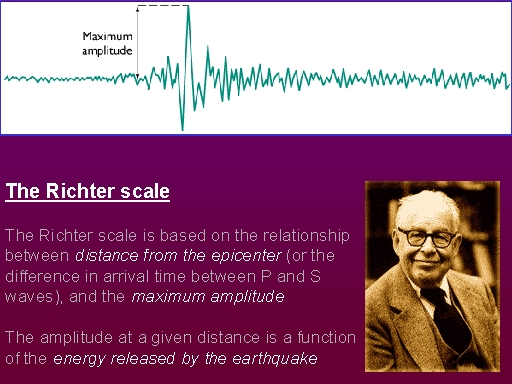
Magnitude is
determined from the seismic wave amplitude.
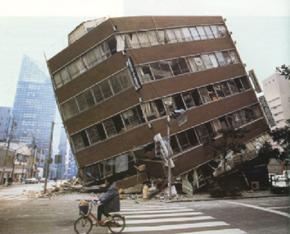
Earthquake intensity refers to amount of damage
caused – more subjective.
Magnitude
Magnitude,
given by general equation:-
M = log10
A/T + a
M = magnitude
log - base 10
A = max. amplitude of wave in µm (= 10-6m)
T = period of wave, (P or S) in secs. (time taken for one wavelength to pass a
fixed point)
a= factor correcting for epicentral distance, focal depth and type of
wave. These can be read from published tables. However, since A needs to
be obtained from observation the "absolute" measure of Earthquake
magnitude is still a subject of debate. Error in magnitude should be <
± 0.3.
Recall, the epicentral
distance from the point of measurement to the epicentre is measured by the
angle subtended by these 2 points at the centre of the Earth - the epicentre
angle (Δ) :
Magnitude
scale is logarithmic, therefore M = 7.0 is 100 times larger than M = 5.0
There
are many definitions of magnitude, depending on what is being measured:
·
Richter
was amongst first to develop a scale for earthquakes in 1935 based on P-wave
amplitudes.
An earthquake's Richter magnitude was originally defined to
be the amplitude of shaking on a Wood-Anderson seismometer of an earthquake
100km away. Since there are very few working Wood-Anderson seismometers around
these days, scientists approximate the magnitude using calibration scales based
on the distance from the source and the amplitude of seismic waves.
·
The Richter local magnitude is given by:
MR
= log10(A/T) + g(Δ,h) + a
- where M is the
magnitude
- A is the maximum
wave amplitude
- T is the wave
period
- g is a function
that corrects for the decrease in wave amplitude(A)
- Δ is the
angular distance from seismometer to epicenter
- h is the focal
depth of the earthquake
- and (a) is an
empirical constant
·
BODY-WAVE
magnitude - At large distances from epicentre use body-wave amplitude (usually
P-wave), because body-wave attenuation is less than surface-waves.
MB
= log10 (A/T) + 0.01Δ + 5.9
where T ~ 12 secs.
· The
surface wave magnitude is given by
MS
= log10 (A/T) + 1.66 log10 Δ + 3.3
- where T is ~17-23
s
- Δ is ~20-160
degrees
- and h (depth of
focus) is less than 50 km
For extremely deep earthquakes the magnitude must be
corrected to compensate for the increased distance due to depth.
· The seismic moment is given by
MO
= G.A.m
- where G is the
rigidity
- A is the
surface area of the fault
- and m is the average fault
displacement
and the moment
magnitude is given by
MM
= 0.666log10MO - 6
· The
moment magnitude can be related to the surface wave magnitude:
log10MO
= 1.5MS + 16.1
Largest
Earthquakes in the World 1900-2003
|
|
Location |
Date |
Mag Coordinates |
||
|
1. |
1960
05 22 |
9.5 |
38.26 S |
72.15 W |
|
|
2. |
1964
03 28 |
9.2 |
61.02 N |
147.65 W |
|
|
3. |
1957
03 09 |
9.1 |
51.57 N |
175.34 W |
|
|
4. |
1952
11 04 |
9.0 |
52.75 N |
159.50 E |
|
|
5. |
1906
01 31 |
8.8 |
1.0 N |
81.5 W |
|
|
6. |
1965
02 04 |
8.7 |
51.23 N |
178.52 E |
|
|
7. |
1950
08 15 |
8.6 |
28.5 N |
96.5 E |
|
|
8. |
Kamchatka |
1923
02 03 |
8.5 |
54.0 N |
161.0 E |
|
9. |
Banda
Sea, Indonesia |
1938
02 01 |
8.5 |
5.25 S |
130.5 E |
|
10. |
Kuril
Islands |
1963
10 13 |
8.5 |
44.9 N |
149.6 E |
Largest
Earthquakes in the World 1900-present (spot the difference)
|
|
Location |
Date UTC |
Magnitude |
Lat. |
Long. |
Reference |
|
1. |
1960 05 22 |
9.5 |
-38.24 |
-73.05 |
Kanamori, 1977 |
|
|
2. |
1964 03 28 |
9.2 |
61.02 |
-147.65 |
Kanamori, 1977 |
|
|
3. |
2004 12 26 |
9.1 |
3.30 |
95.78 |
Park et al., 2005 |
|
|
4. |
1952 11 04 |
9.0 |
52.76 |
160.06 |
Kanamori, 1977 |
|
|
5. |
1906 01 31 |
8.8 |
1.0 |
-81.5 |
Kanamori, 1977 |
|
|
6. |
1965 02 04 |
8.7 |
51.21 |
178.50 |
Kanamori, 1977 |
|
|
7. |
2005 03 28 |
8.6 |
2.08 |
97.01 |
PDE |
|
|
8. |
1950 08 15 |
8.6 |
28.5 |
96.5 |
Kanamori, 1977 |
|
|
9. |
1957 03 09 |
8.6 |
51.56 |
-175.39 |
Johnson et al.,
1994 |
|
|
10. |
2007 09 12 |
8.5 |
-4.438 |
101.367 |
PDE |
|
|
11. |
1938 02 01 |
8.5 |
-5.05 |
131.62 |
Okal and Reymond,
2003 |
|
|
12. |
Kamchatka |
1923 02 03 |
8.5 |
54.0 |
161.0 |
Kanamori, 1988 |
|
13. |
1922 11 11 |
8.5 |
-28.55 |
-70.50 |
Kanamori, 1977 |
|
|
14. |
Kuril Islands |
1963 10 13 |
8.5 |
44.9 |
149.6 |
Kanamori, 1977 |
Energy
and Magnitude
·
The
energy released by an earthquake (E in Joules) is related to magnitude.
·
An
empirical relation between energy and magnitude is given by:
Log10
E = 1.5MS + 4.8
·
An
increase in magnitude of 1.0 unit in MS gives ~30 x increase
in energy.
·
The
estimated annual energy loss via earthquakes is ~1018 J.
·
Most
of this comes from the few quakes with MS ~ 7 or 8.
·
The
energy of an earthquake is turned largely into heat via friction of vibrating
rock particles, etc..
·
The
total contribution of an earthquake to heat loss is small.
·
The
total Earth heat flow is ~ 1021 J per y. The total U.S.A.
energy consumption is ~1019 Jy-1!
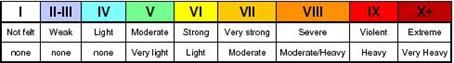
Intensity
·
The
intensity of an earthquake is based
on its effects at the surface.
·
For a given location intensity is reported as Roman Numerals according to the
modified Mercalli Scale:
|
Intensity |
Description |
|
I |
Not Felt. |
|
II |
Felt by persons at rest on upper floors. |
|
III |
Felt indoors; hanging objects swing; vibration like passing
of light trucks. |
|
IV |
Vibration like passing of heavy trucks; standing cars rock;
windows, dishes, doors rattle; walls, frames creak. |
|
V |
Felt outdoors; sleepers wake; liquids spill; small objects move;
doors swing; shutters and pictures move. |
|
VI |
Felt by all; frightening; people walk unsteadily; windows,
objects broken; objects knocked off shelves, pictures off walls; furniture
moved or overturned; weak plaster cracked; small bells ring; trees and bushes
shaken. |
|
VII |
Difficult to stand; furniture broken; damage to weak materials;
cracking of masonry; fall of plaster, loose bricks, and tile; waves on ponds;
water muddy; small slides along sand or gravel banks; large bells ring. |
|
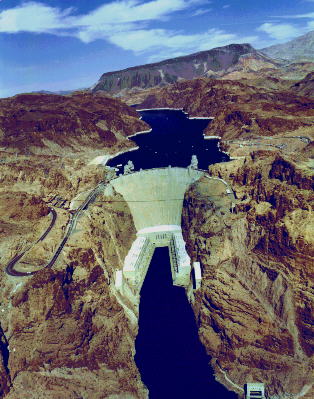
VIII |
Steering cars affected; damage to, and partial collapse, of
masonry; fall of chimneys, towers; frame houses moved on foundations if not
bolted down; changes in flow of springs and wells. |
|
IX |
General panic; frame structures shifted off foundations if
not bolted down; frames cracked; serious damage even to partially reinforced
masonry; underground pipes broken; reservoirs damaged; cracks in ground. |
|
X |
Most masonry and frame structures destroyed with their
foundations; serious damage to dams and dikes; large landslides; rails bent slightly. |
|
XI |
Rails bent greatly; underground pipelines out of service. |
|
XII |
Damage nearly total; large rock masses shifted; objects
thrown into the air. |
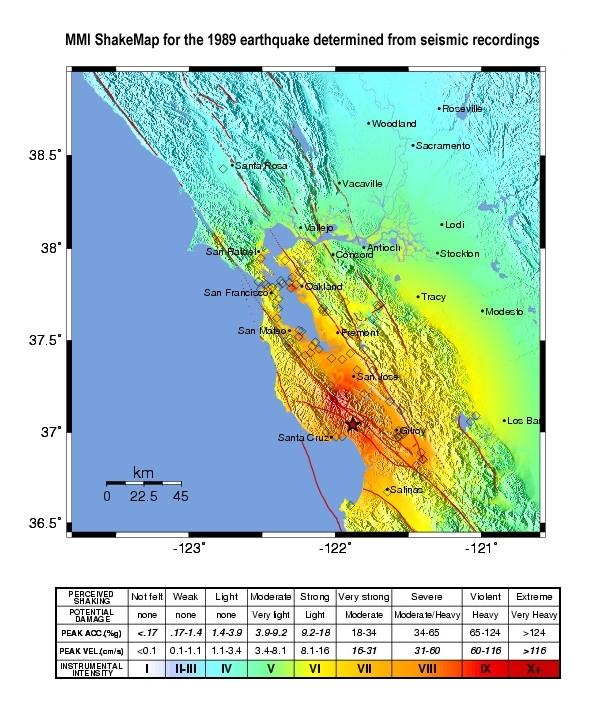
·
Factors
that tend to increase intensity:
o magnitude of
Earthquake
o distance to focus
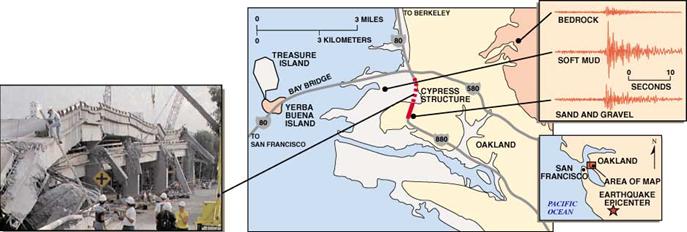
o substrate
o
·
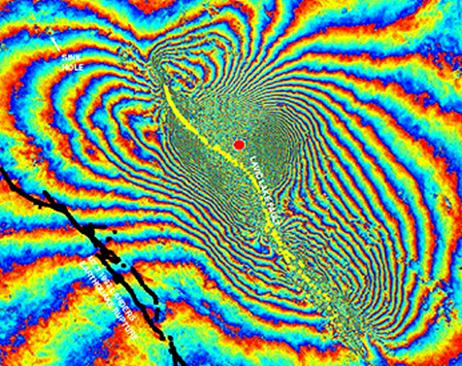
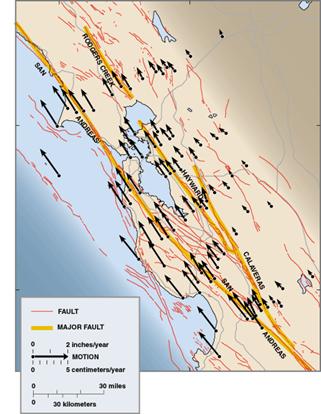
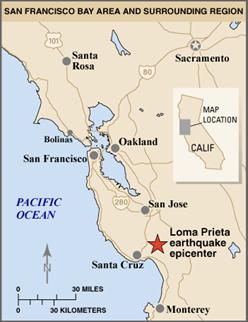
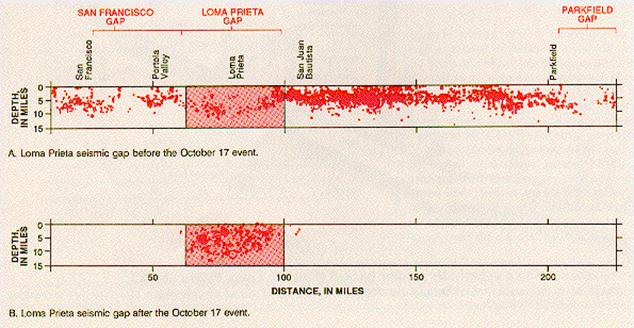
1989
Loma Prieta event:
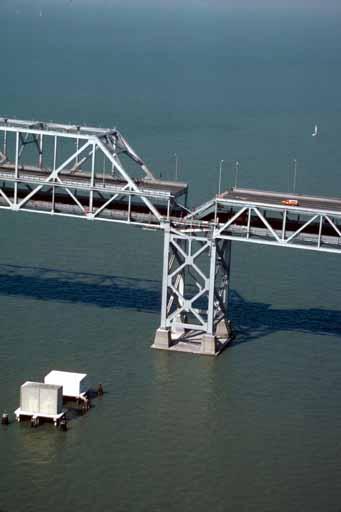
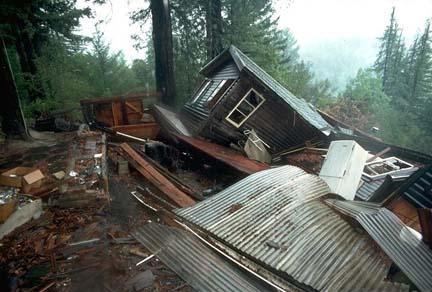
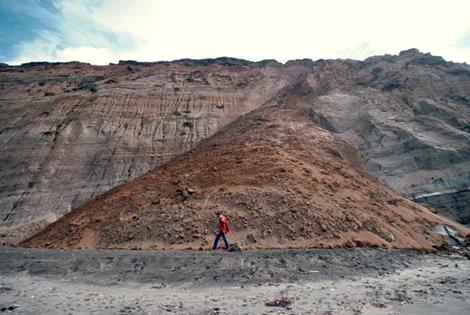
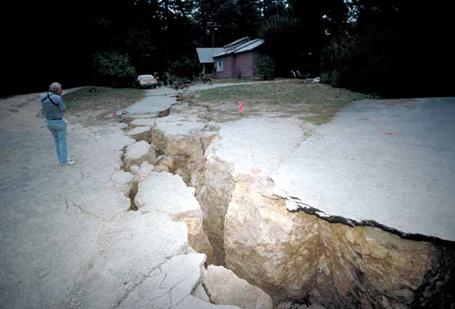
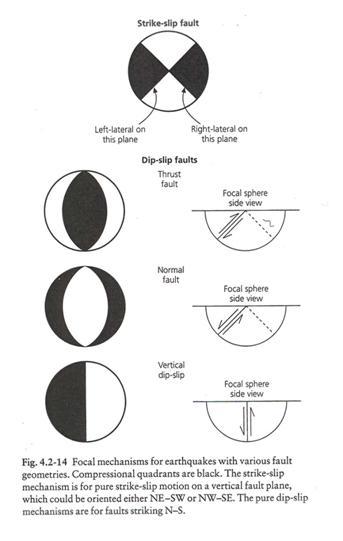
Seismotectonics
Earthquake Focal
Mechanisms
o In any given
direction P waves radiate from focus as compression or dilatation. The
pattern of initial motion (first motion)
characterizes the nature of the fault motion that produced the earthquake
(normal, reverse, strike-slip)
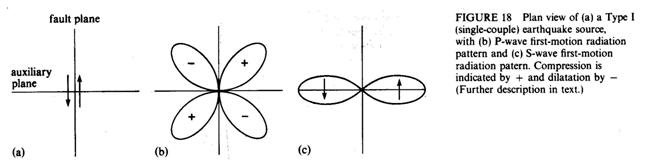
o Thus of a strike slip
fault:
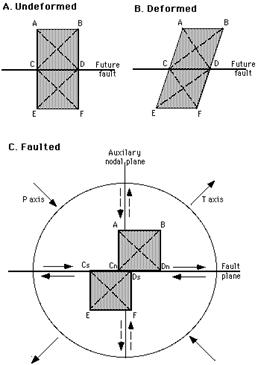
Can
define the fault plane from the
plane normal to fault (the auxiliary
plane)
o The first shock reveals a good deal about
the nature of the fault. Depending on whether a particular area is compressed
or extended by movement along the fault, the first motion p-wave will be upwards (positive) or downwards (negative),
respectively.
o The pattern of first
motions obtained from a number of seismic stations can be summarized on a stereogram,
depicting quadrants of compression and dilation.
o
On a stereonet there are two planes, drawn along great
circles, separating the compressional (positive) p-waves from the extensional
(negative) p-waves.
o
These planes are known as nodal planes.
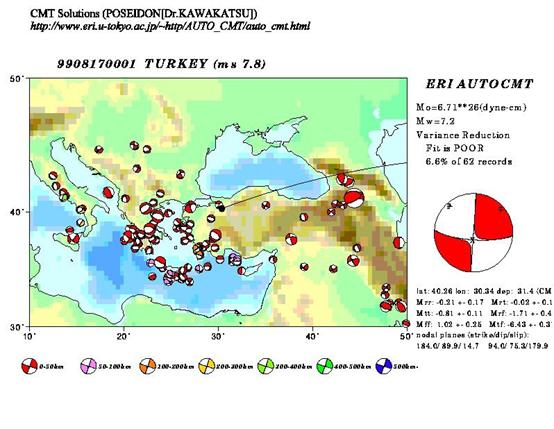
o From this we can infer nature of faulting – focal mechanism solutions (black-
compression, white- dilatation).
o Note: the observed
pattern of arrivals does not uniquely determine the orientation of the fault.
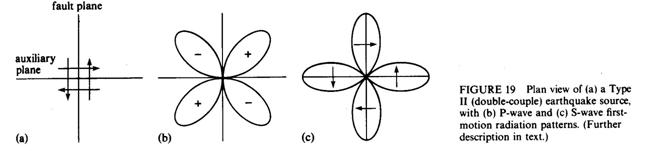
o
From P waves alone cannot
tell fault plane from auxiliary plane:

o
If the source is a single-
couple one, can tell from S-waves distribution:
o But if movement on
the fault is complex (“double couple”),
then the solution is still ambiguous:
o
To determine the correct plane, the locations of aftershocks
and/or surface geology and regional tectonics may be necessary.
Mixed Faults
It
is very unusual to find a pure strike-slip, normal or thrust fault in nature.
Most faults consist mainly of one motion with a small component of another.
Pure strike-slip faults have first motion diagrams with nodal planes that
intersect in the center of the stereonet (as pictured above). Strike-slip
faults that have some component of thrust or normal faulting intersect
off-center.
This
is either a left-lateral or right-lateral strike slip fault with a component of
thrust faulting. The nodal planes for pure normal faults and pure thrust faults
intersect along the primitive circle (as pictured previously). Strike-slip
faults can have components of either normal or thrust faulting, but normal and
thrust faults can only have components of strike-slip faulting. Here's the
first motion patterns of an oblique normal fault and an oblique thrust fault
with a small component of strike slip motion.
|
|
The first motion pattern for thrust faulting with a small
component of left lateral strike-slip motion would look the same (except the
compression and extension circles would be reversed). |
|
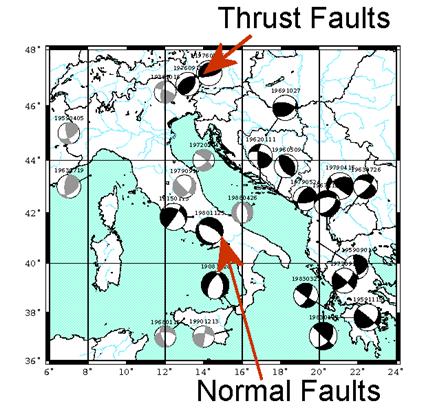
Earthquakes
and Plate Tectonics
Different
earthquakes are characteristic of different tectonic setting revealed by the study
of focal mechanisms.
Divergent
boundaries
- shallow focus earthquakes, normal and strike slip faults along mid-ocean
ridge:
Convergent
boundary -
earthquakes at all depth and all magnitudes. Extentional or compressional
depending on position:
o Thrust faults in
upper part of subducting slab,
o normal faults at
depth
Continental collision
zones
show only shallow and intermediate depth EQ.
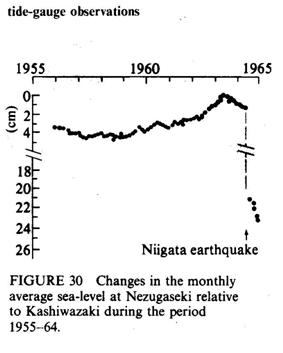
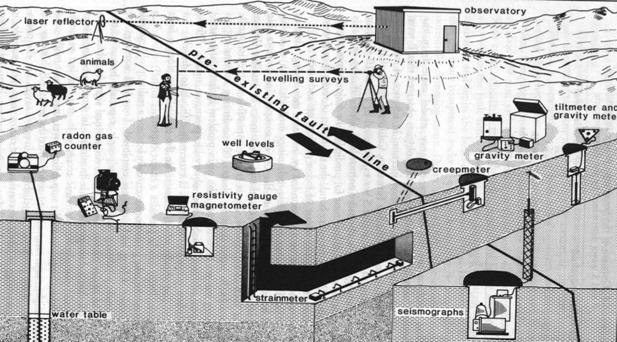
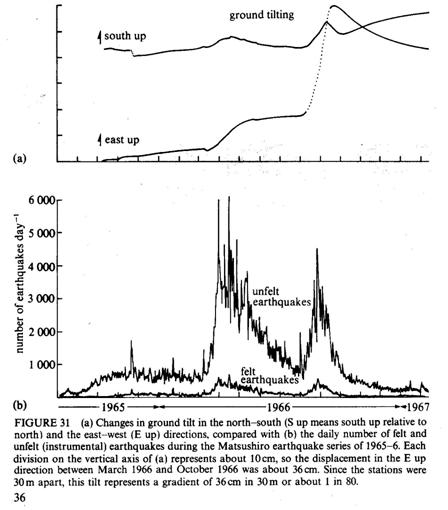
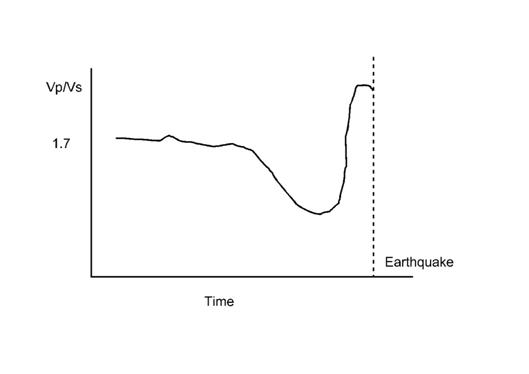
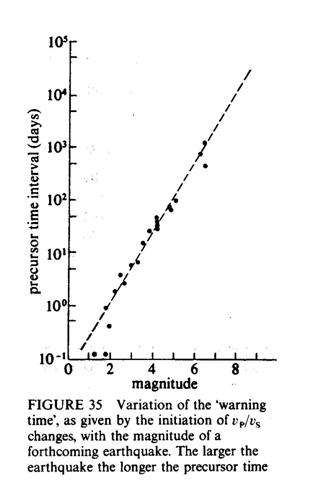
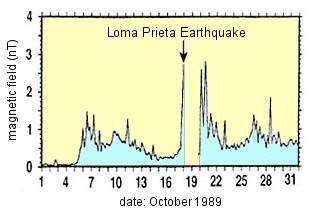
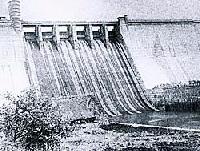
Earthquake prediction
Social
impact of earthquakes in regions of high population are obvious.
If
we could predict when an earthquake will occur, it could reduce effect of quake
on death toll, etc..
U.S.A.,
Japan and China have large programmes.
Tokyo
and Peking are "at risk" cities.
Current
results in prediction are poor - still need more data on earthquake processes.